

Could tiny millisecond shifts between heartbeats tell you when to push hard or when to rest?
Heart rate variability measures the small timing differences between beats. These splits reflect how the autonomic nervous system balances stress and recovery.
Think of it as your body’s readiness meter: higher numbers often mean more resilience, while lower values can hint at stress, fatigue, or illness approaching.
This guide breaks down the science in plain English and gives practical steps to use these signals for smarter training and better rest. We cover what affects rate variability, why nighttime readings make a stable baseline, and how to interpret trends over weeks.
Different devices vary in accuracy, so focus on consistent methods and the same timeframe to build a reliable personal baseline. Learn tech tips and simple routines you can try today, and see how small tweaks can change long-term recovery.
For deeper device guidance, see Polar’s expert guide and a practical list of affordable biohacking tools to help you measure and act on your data.
Key Takeaways
- Heart rate variability tracks millisecond differences between beats and reflects nervous system balance.
- Nighttime, sleep-based readings give the most stable baseline for comparison.
- Personal trends matter more than single numbers—use your baseline to guide decisions.
- Higher readings often align with “go” days; lower readings suggest rest or stress management.
- Choose consistent devices and methods; accuracy varies across wearables.
- Use quality guides like Polar’s resource and practical tools to start measuring reliably.
Polar guide affordable biohacking tools
Why Heart Rate Variability Matters Right Now
Tiny beat-to-beat differences give an early signal about how your body is coping with day-to-day load. They often move before your energy crashes or a cold shows up, so you can act sooner.

Heart rate variability reacts quickly to stress, sleep loss, travel, and illness. That makes it a sensitive barometer of recovery and short-term health.
On days when your hrv sits above your baseline, the body usually tolerates harder activity. When values drop, rest or lighter exercise may be smarter.
Age and sport history shape your baseline: younger people and endurance athletes often have higher rate variability than others. Daily swings occur with movement, caffeine, and emotions, so night averages tell a clearer story.
Quick uses:
- Spot early illness or fatigue and reduce load.
- Pick hard workouts on higher-than-usual days.
- Watch trends so small stressors don’t add up into bigger health problems.
For medical context and symptom guidance, see Cleveland Clinic on heart rate variability. To tailor activity, try this exercise quiz.
| Why it matters | Short sign | Action |
|---|---|---|
| Early illness signal | Values dip before symptoms | Rest, hydrate, monitor |
| Performance gating | Higher than baseline | Schedule intense activity |
| Chronic load detection | Gradual downward trend | Reduce stressors, improve sleep |
The Science of HRV in Plain English
Small timing changes between beats reflect how your nervous system balances demand and rest. These millisecond shifts are simple to measure and useful to interpret over time.
Heart rate variability: tiny, healthy differences between beats
A few milliseconds of wobble in your heartbeat reveal how the autonomic nervous system responds to stress or rest.
The heart does not beat like a metronome; that natural jitter is normal and valuable. Over days, that jitter tells you when to push and when to pause.
RR intervals, R‑peaks, and RMSSD: the metrics under the hood
Devices detect R‑peaks on an ECG-like signal and measure RR intervals — the time between successive peaks in milliseconds.
RMSSD is a common metric that summarizes short-term, beat-to-beat changes. WHOOP and other tools use RMSSD for quick readiness insights.
Autonomic nervous system balance: parasympathetic vs sympathetic
Your autonomic nervous system sends continuous faster and slower instructions. The parasympathetic branch widens gaps between beats and raises variability.
The sympathetic branch tightens timing, raises heart rate and blood pressure, and lowers variability during stress or exercise. Higher variability usually signals good recovery; lower values can mean sympathetic dominance or fatigue.

| Metric | What it measures | Typical interpretation |
|---|---|---|
| RR intervals | Time between R‑peaks (ms) | Raw data for variability |
| RMSSD | Short-term beat-to-beat changes | Readiness and recovery signal |
| Average rate | Mean beats per minute | Workload vs rest context |
Want a deeper primer on what this number means? See what is HRV.
To pair this science with calming movement, try these gentle somatic exercises.
HRV Tracking Explained: How, When, and What to Measure
Measuring during sleep avoids daytime noise and builds a dependable baseline you can actually use. Nighttime measures cut out meals, caffeine, and temperature swings that skew daytime snapshots.
Measure heart rate variability during deep sleep to get a stable reference. Devices like WHOOP and Oura compute nightly values and pair them with resting heart rate and sleep scores to estimate recovery.

Nighttime measurement for stable baselines vs daytime fluctuations
Prioritize night data: the body is quieter and the autonomic nervous system settles into a consistent pattern.
Daytime readings jump with food, conversation, and exercise, so they are poor for baselines but useful for spotting acute shifts.
From single readings to trends: average HRV, HRV ms, and personal baselines
Think in baselines. Gather 2–3 weeks of nightly averages before you judge a single number. HRV ms is the millisecond metric you’ll see; keep methods consistent so values compare.
- Combine nightly HRV with resting heart rate and sleep metrics for clearer insight.
- Don’t overreact to one low reading—use trends over time instead.
- Log travel, illness, or big workouts to explain outliers.
| What to measure | Why it helps | Actionable use |
|---|---|---|
| Nightly average HRV (ms) | Stable baseline for recovery | Compare morning values to rolling 2–3 week baseline |
| Resting heart rate | Complements variability for readiness | Use with HRV trends to decide intensity |
| Daytime spot checks | Shows acute responses to stress or training | Use selectively after meditation or workouts |
For practical sleep habits that sharpen your nightly data, see this trial where I tracked my sleep for 30.
What Influences HRV: Biology, Lifestyle, and Training Load
Three main buckets—biology, daily choices, and training load—combine to shape your heart’s beat-to-beat pattern. This section names the major factors and shows which you can change and which set your baseline limits.
Below are the uncontrollable and controllable influences that move the number you track each morning.
Factors you can’t control
Genetics, age, and hormone cycles set your long-term baseline. Expect lower averages as you age and cyclical shifts across menstrual phases. Illness and immune responses also push values down; a sustained dip often precedes symptoms.
Factors you can control
Sleep regularity, hydration, and nutrition powerfully shape day-to-day variability. Calm evening routines and consistent meals support recovery. Alcohol can depress readings for several days; plan social nights around key training blocks.
Age and activity patterns
Younger people and endurance-trained bodies tend to show higher numbers than strength-focused athletes. Heavy training blocks lower values at first; with rest, values rebound as adaptation occurs. Focus on your trend, not comparisons.
| Bucket | Main influences | Actionable tip |
|---|---|---|
| Biology | Genetics, age, hormones, illness | Track baseline; expect age-related decline |
| Lifestyle | Sleep, hydration, nutrition, alcohol, environment | Prioritize sleep and hydrate; limit alcohol near key sessions |
| Training load | Frequency, intensity, recovery cycles | Use deloads during sustained drops; monitor trends |
For a deeper review of physiological mechanisms, see this hrv research review.
Using HRV to Guide Training, Rest, and Recovery
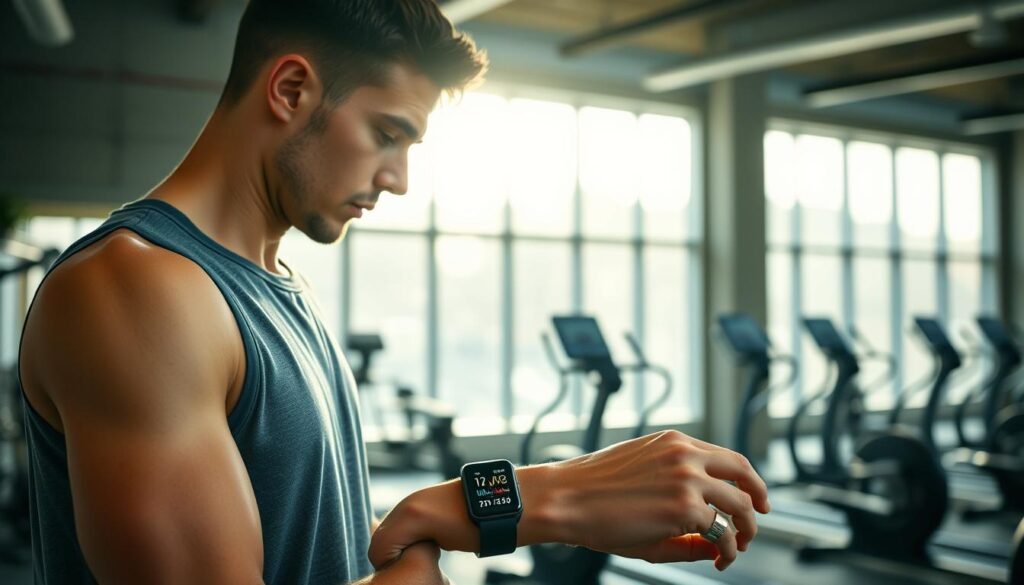
Morning variability gives a practical cue for daily training decisions. Read it alongside sleep and how you feel to choose hard sessions, technique days, or rest.
Morning readings help you match daily training to your real-time recovery, not your calendar plan. After big efforts, values usually dip. With proper rest and fueling, they climb back and signal readiness to push again.
Adaptive training: push on higher readings, deload on lower ones
Use the number as a dial, not a rule. When values trend above your baseline, plan longer or higher-intensity workouts. When they fall below, favor mobility, easy aerobic work, or skill sessions.
- Context matters: a low reading after a race is normal; a low reading after rest may mean stress, dehydration, or illness.
- Modulate weekly load: schedule big sessions on higher-readiness days and deload when the number flags cumulative fatigue.
- Combine signals: pair heart rate variability with perceived effort, sleep quality, and resting heart rate before changing plans.
- Protect recovery blocks: don’t chase numbers during rebuild days—use extra sleep and light activity to let values normalize.
- Team use: coaches can individualize the same practice session—some athletes push, others focus on drills—based on morning readiness.
After illness or travel, watch for several stable mornings before resuming maximal training. For clinical context, see this clinical guide to variability. For practical device notes and Oura comparisons, read this Oura data primer.
How to Improve HRV with Everyday Habits
Tuning daily rhythms gives your nervous system predictable cues that boost nightly recovery. Small, repeatable changes to sleep, hydration, and stress practices move your baseline more than occasional big efforts.

Sleep quality and consistency: align circadian rhythm for better recovery
Make sleep sacred. Go to bed and wake at similar times, keep the room cool and dark, and finish dinner earlier to protect night signals.
Hydration, alcohol, and nutrition: small choices with big effects
Hydrate proactively — aim for roughly one ounce per pound of bodyweight daily and adjust for activity and heat.
Rethink alcohol timing: a single evening of drinks can blunt your heart rate variability for up to five days. Plan easy sessions and extra fluids afterward.
Auto-regulation and stress management: breathwork, mindfulness, and timing
Try 5–10 minutes of slow nasal breathing, box breaths, or guided mindfulness each evening to nudge the parasympathetic nervous system toward rest.
- Stack intense exercise earlier in the day and follow with a protein-rich meal.
- Keep meals and light exposure regular to stabilize circadian cues.
- Test one change per week — cooler bedroom, earlier dinner, or less alcohol — and watch how your nightly hrv responds.
Devices and Accuracy: Making Sense of Wearables and Metrics
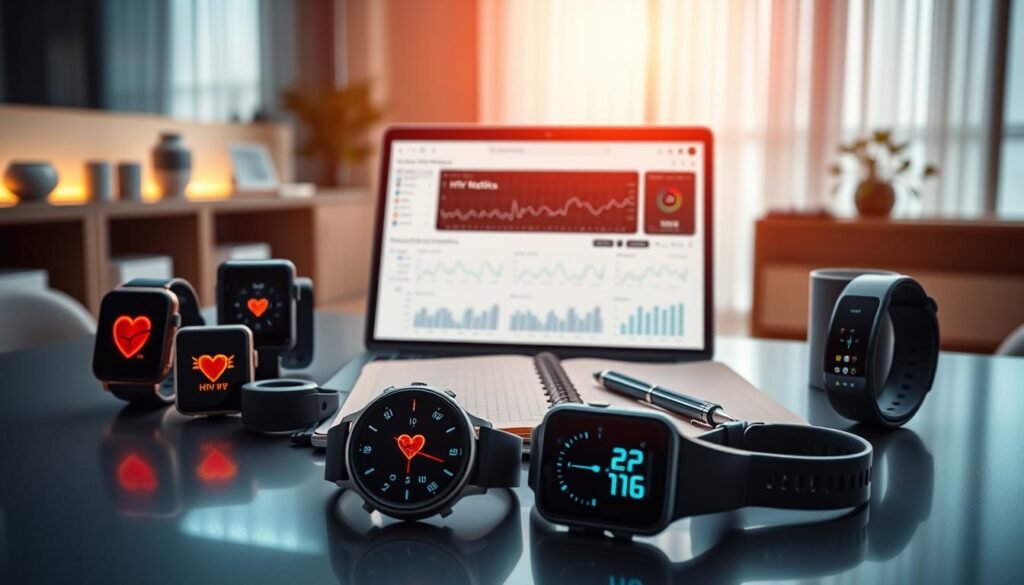
Not all wearables read the same pulse; some focus on nightly windows while others aim for 24/7 snapshots. Pick a device that matches whether you want lifestyle readiness or workout precision.
How devices measure and why sleep windows matter
Many wearables estimate variability from optical sensors, but validated algorithms and sleep-based windows deliver the cleanest baselines.
Optical sensors are convenient for day-to-day use. They can struggle during motion. Nighttime measurements reduce noise from meals, caffeine, and activity and give a more stable number to compare over weeks.
Finding the right form factor for your goals
WHOOP measures variability in deep sleep and reported 99.7% heart rate and 99% HRV accuracy in an AIS-funded CQUniversity Sensors study.
Oura captures average nightly variability and feeds it into a readiness score. Polar offers multisport watches (Vantage V3, Grit X2 Pro) and the Polar H10 chest strap, a gold standard for heart rate during intense sessions.
- Weigh accuracy: chest straps like Polar H10 excel for high-intensity training.
- Choose comfort: rings and remote sensors suit 24/7 lifestyle monitoring.
- Try optical armbands: Polar Verity Sense is a strap-free option for steady-state workouts.
- Stick to one method: consistent devices and windows keep trend lines valid.
| Device type | Strengths | Best use |
|---|---|---|
| Chest strap (Polar H10) | High accuracy for heart rate and intervals | High-intensity training, lab-style sessions |
| Wrist watch (Polar Vantage, Grit X) | Multisport features, navigation, long battery | Endurance sports and daily activity logging |
| Ring (Oura) | Comfortable, reliable nightly averages | Sleep-based readiness and lifestyle monitoring |
| WHOOP band | Validated sleep-window metrics and Recovery Score | Daily strain and recovery guidance |
Practical takeaway: if you want 24/7 readiness, pick devices that prioritize sleep-based metrics. If you want workout precision, choose chest straps or sport watches with robust sensors.
For guidance on interpreting wearable outputs and making sense of device ecosystems, see this primer on making sense of wearable data and a cost-benefit review of ring options like Oura at is the Oura ring worth it.
Reading Your HRV Patterns Over Time
Short swings happen every day, but meaningful shifts emerge only when you watch the number across days, weeks, and months. Follow patterns, not individual mornings, to tell whether your autonomic nervous system is handling life and training or accumulating stress.

Daily swings vs meaningful trends: what changes signal stress or readiness?
Daily fluctuations are normal. One low night could follow alcohol, late meals, heat, or a hard workout.
Separate noise from signal: look for runs of low values across several days before changing your plan.
Higher-than-baseline nights often follow good sleep, light activity, or mindful recovery work. Lower nights often track with dehydration, travel, illness, or intense sessions.
Short-, medium-, and long-term views: interpreting weeks to months of data
Short term (2–4 days): use this to confirm whether a dip persists. Brief drops during heavy training blocks are common.
Medium term (weeks): watch for rebound after deloads. If values stay suppressed, improve sleep, hydration, and nutrition and reduce load.
Long term (months): lifestyle changes — new job, parenting, travel — can shift your baseline. Recalibrate goals when your long-term number moves.
- Keep a context log: annotate illness, travel, and big sessions so you can interpret outliers.
- Align hard days with higher values and recovery days with lower ones during demanding cycles.
- Remember individual ranges: compare only to your own baseline, not friends or averages.
For research on physiological patterns and autonomic responses, see this review on PubMed and read a practical first-person account of paced breathing and movement for nervous system recovery.
Physiology review · personal nervous system story
Conclusion
Treat your variability trend like a conversation with your nervous system. Use nightly, sleep-based measures to build a steady baseline, then act on trends rather than one-off numbers.
Heart rate variability reflects autonomic balance and responds to stress, load, and lifestyle. Track it consistently at night. Let higher mornings guide hard sessions and falling runs prompt extra rest or easier work.
Keep comparisons personal. Pair a sleep-focused device like Oura or WHOOP with a Polar chest strap or watch for workout accuracy. Change one habit at a time, watch your data for 1–2 weeks, and keep what improves your trend.
Small, steady choices—better sleep, hydration, and stress habits—move the needle more than guesswork.
FAQ
What is heart rate variability and why does it matter?
Heart rate variability measures the small, healthy differences in timing between heartbeats. It reflects the balance between the parasympathetic (rest-and-digest) and sympathetic (fight-or-flight) branches of the autonomic nervous system, giving a window into stress, recovery, and overall cardiovascular resilience.
How does the autonomic nervous system affect heart rhythm?
The autonomic nervous system continuously adjusts heart rate through sympathetic and parasympathetic signals. Sympathetic activity speeds the heart and reduces variability; parasympathetic activity slows the heart and increases variability. Together they create the beat-to-beat fluctuations that indicate how your body responds to stress, exercise, and rest.
What are RR intervals, R‑peaks, and RMSSD in simple terms?
RR intervals are the time gaps between successive heartbeats (from one R-peak in the ECG to the next). RMSSD is a common metric that calculates short-term variability between those intervals and is sensitive to parasympathetic activity. These measures help translate raw heartbeat timing into actionable scores.
When should I measure variability—night or day?
Nighttime measurements usually give the most stable baseline because sleep reduces external disturbances and activity-driven fluctuations. Daytime readings capture how stress, exercise, and lifestyle affect variability throughout the day. Use consistent timing for trend tracking.
Should I focus on single readings or long-term trends?
Prioritize trends over single readings. One measurement can vary with caffeine, hydration, or a restless night. Weekly or monthly averages reveal meaningful changes in recovery, training adaptation, and chronic stress levels.
What factors lower variability that I can’t control?
Age, genetics, hormonal cycles, and some medical conditions influence baseline variability. Acute illness or infections also temporarily reduce variability. Knowing these limits helps set realistic personal baselines.
What lifestyle factors can I change to improve my score?
Improve sleep quality and consistency, stay hydrated, moderate alcohol, eat nutrient-rich meals, and manage stress with breathwork, mindfulness, or short walks. Regular, appropriately dosed exercise—especially aerobic and steady-state training—also supports higher variability over time.
How does training load affect variability and recovery?
Heavy training and insufficient recovery lower variability, signaling the need to reduce intensity or volume. Conversely, higher variability often indicates readiness for harder workouts. Use variability as one input for auto-regulation: push when your body is ready, deload when it isn’t.
Which devices give the most reliable measurements?
Chest straps and medical-grade ECG give the highest accuracy for beat-to-beat intervals. Many multisport watches, finger rings, and validated wearables provide useful sleep-based or resting measures when they use reliable sensors and algorithms. Check peer-reviewed validation where possible.
How should I interpret daily swings versus meaningful trends?
Daily swings are normal—caused by caffeine, stress, exercise, and sleep quality. Meaningful trends are consistent rises or falls across weeks to months. Look for persistent deviations from your personal baseline rather than reacting to single low or high days.
Can hydration and alcohol quickly change variability?
Yes. Dehydration typically lowers variability, while moderate to high alcohol intake can depress variability for hours to days. Small choices around fluids and drinking schedules have measurable effects on recovery metrics.
Are higher numbers always better?
Not always. Generally, higher variability indicates greater parasympathetic activity and better recovery, but context matters. Extremely high values outside your normal range, or sudden spikes tied to illness or irregular rhythms, should be interpreted cautiously and discussed with a clinician.
How do age and fitness level influence typical values?
Younger people and endurance-trained athletes tend to show higher variability due to stronger parasympathetic tone. Variability normally declines with age, so compare values to your own baseline rather than population averages.
Can breathing exercises and mindfulness change variability quickly?
Yes. Slow, paced breathing and short mindfulness sessions can boost parasympathetic tone and increase variability within minutes to hours. Regular practice compounds benefits and helps improve recovery scores over time.
When should I see a doctor about abnormal readings?
Consult a healthcare professional if you notice prolonged, unexplained drops in variability accompanied by symptoms such as chest pain, fainting, persistent dizziness, or palpitations. Wearable data can guide conversations but isn’t a substitute for medical evaluation.